
Market Highs and Long-Term Discipline
Quick Take
All-time highs in stocks can cause unease about an impending market drop, but history suggests that only a handful of all-time highs have led to stock market declines. Most have led to more new all-time highs and stock market gains.
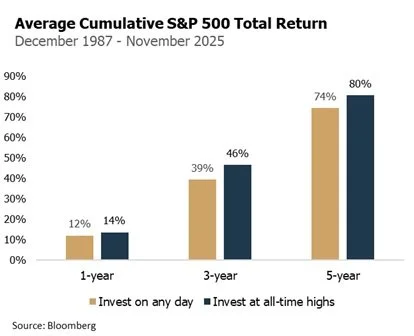
In fact, there is little difference in subsequent average stock market returns for an investor purchasing stock at all-time highs versus any other day of the year.
All-time highs for stock markets are cause for celebration. We tally up our gains and pat ourselves on the back. But concurrently, a bit of apprehension follows. We know stock markets rise and fall, so it’s natural to wonder whether this is the turning point.
The familiar debate begins: should we take profits now and wait to buy back at lower prices? It’s a tempting idea, as if record highs were a reliable indicator of trouble ahead. But history tells a different story – more often than not, all-time highs are followed by even more all-time highs.
Stocks and All-Time Highs
Since 1928, the S&P 500 has achieved all-time highs in 6% of trading days (illustrated as the gold dots on the chart below). Said differently, the index averages 15 new highs per year, or a new high every couple weeks.

While markets sometimes decline after setting new records, those instances are statistical outliers. Most all-time highs have led to additional highs and continued market gains.
Noticeably, new all-time highs tend to cluster during market upturns. After the global financial crisis, the S&P 500 advanced significantly for more than a decade and achieved new highs in 14% of trading days. The incredible market run in the 1990s saw all-time highs 12% of the time. More striking, the index’s linear ascent upward during 2021 saw new highs on average once every four days.
Since 1928, subsequent 1-year performance was positive 85% of the time after the S&P 500 hit an all-time high. Subsequent 3-year performance looked even better, as returns were positive 92% of the time. Longer holding periods provided even more favorable outcomes.
In fact, there is little difference in average subsequent returns for an investor purchasing stocks at all-time highs versus on any other day of the year. Average returns actually slightly favored the investor purchasing only at all-time highs. The lesson: a market correction is no more likely at all-time highs than investing on any other day of the year.
What It All Means
There are no guarantees, but the stock market doesn’t usually subscribe to the laws of gravity. There are a few reasons why. Human behavior tends to reinforce trends - optimism builds on itself during strong markets - and new highs often occur when the broader economy is healthy and corporate earnings are robust.
History shows that stocks tend to move higher over time but can go through painful, unexpected declines too. It’s helpful to use history as a guide when we are left pondering what to do next. A few record highs will lead to market declines, but most will lead to more all-time highs and stock gains.
Contact us at 865-584-1850 or info@proffittgoodson.com